


Team
Decadis at ShipHappens 2025
20
Nov
2025
monday.com reporting is one of users' favorite project management platforms as it's highly valued for its versatility and scalability, affordable price, feature sets, and numerous integrations with external software. It's a visual project management tool with an intuitive and customizable interface where users can insert widgets for reporting and leverage advanced monitoring features.
In this article, we will provide an overview of reporting on monday.com and its main features. Additionally, we will provide you with expert tips on how to extend your monday.com reporting and guide you on how to establish a connection between monday.com and other platforms with the help of connectors to provide significant potential for businesses.
monday.com operating system is cloud-based, and with the available tools, teams create workflows for managing processes and projects, prioritizing tasks, and sharing files. It has working models for managing and organizing the activities of a team or enterprise; however, it can also be adapted for use internally among different departments of a company, like marketing, design, HR, and more.
The platform is structured on the following levels:
But let's have a look at monday.com's reporting capabilities.
monday.com dashboard reporting is an excellent tool for quickly seeing what is essential that facilitate the workflow and show an outline of different boards with 30 available monday.com widgets and apps. They allow users to monitor any relevant information, like budget or project progress, in one layout. Users can create summaries and reports and centralize data in one location. Within the dashboard, one can also include valuable tools for assigning and prioritizing tasks intelligently, sharing files, and seeing who is doing what at any time.
Flexibility is a distinctive feature of the monday dashboard, as it can be configured as either public or private, with the option to connect multiple dashboards for a more comprehensive perspective, subject to plan limitations. Users can filter, export, and present data in various formats. Private dashboards can be effortlessly shared with team members, with permissions and restrictions easily managed by the owner to control access and usage.
Customizability is another key strength of the monday.com dashboard, offering a range of templates to organize elements, sub-elements, and groups according to specific needs. Real-time synchronization ensures that all stakeholders stay informed of the latest developments, with the ability to edit and refresh data as needed. When the data is live, one can edit and refresh them in real-time; the dashboard is just a readable report when they are off.
A board is a powerful monday reporting tool used as a specific screen to make workflows function efficiently and monitor and manage all the information, starting from simple daily tasks to more complicated projects. It’s completely interactive and makes it possible to work on tasks with the whole team. Three kinds of boards have the same structure: main, shareable, and private. The difference is in the access level that one can change through the board settings.
The board owner can be the person who created it or any subscriber who is also nominated as a co-owner by the admin or initial owner. The board description helps to recognize the main use and other relevant information such as the Workplace where it’s located, its owners, the board creator, and the date. The board items can be sorted or filtered to narrow down and focus on specific ones, and if necessary, one can transform favorite boards into templates or use them with monday.com widgets and track the required information.
The board is facilitated by an AI Assistant that generates items based on the topic one input, and interactive chat provides all the information about each board’s item to every team member. If the board is out of use, one can delete or archive it, and while deleted boards can be retrieved for 30 days, the archived board can be retrieved indefinitely. If the deleted or archived board was connected with other boards, they could also be deleted or archived.
Workdocs are used to unite teams and departments and conceptualize ideas. It outlines information about the people and ideas discussed in the reporting monday.com widget that covers different reporting features. It’s a kind of flexible whiteboard with all the related information, and even when one adds new information, it comes together in one place where all other ideas are stored.
There are three types of workdocs: main, private, and shareable. The main one is visible to any team member between admin, member, or viewer within the account. A private workdoc is just seen by the person who created it or the member who was invited. Shareable is used to share work with clients or freelancers. The member can be turned into an owner, and the permissions to edit documents can be changed.
The doc style, such as layout, font size, and style, can be customized, and the AI Assistant provides new possibilities to gather data, create a clear overview, and generate text to be added to the document. Team members can communicate effectively, organize workdoc using the table of contents, see the progression of workdoc, or even restore its older version.
To stay aligned with the goals, the business can use basic reporting with monday.com to manage boards and handle the presented information most suitably. This feature helps teams to update boards and dashboards automatically and add new data. All the changes are visible, and the teams always have a finger on the pulse of business activity.
Here are the basic monday.com reporting features:
Advanced reporting in monday.com is used by companies with many customers, complex projects, and significant workforces to analyze large amounts of business data and get deeper insights. It lets us identify trends and make informed decisions.
However, even advanced reporting sometimes encounters obstacles. For these situations, we would like to present you with a small but powerful friend on your side: sumUp for Monday.
Here are the advanced features and functionalities within monday.com advanced reporting:
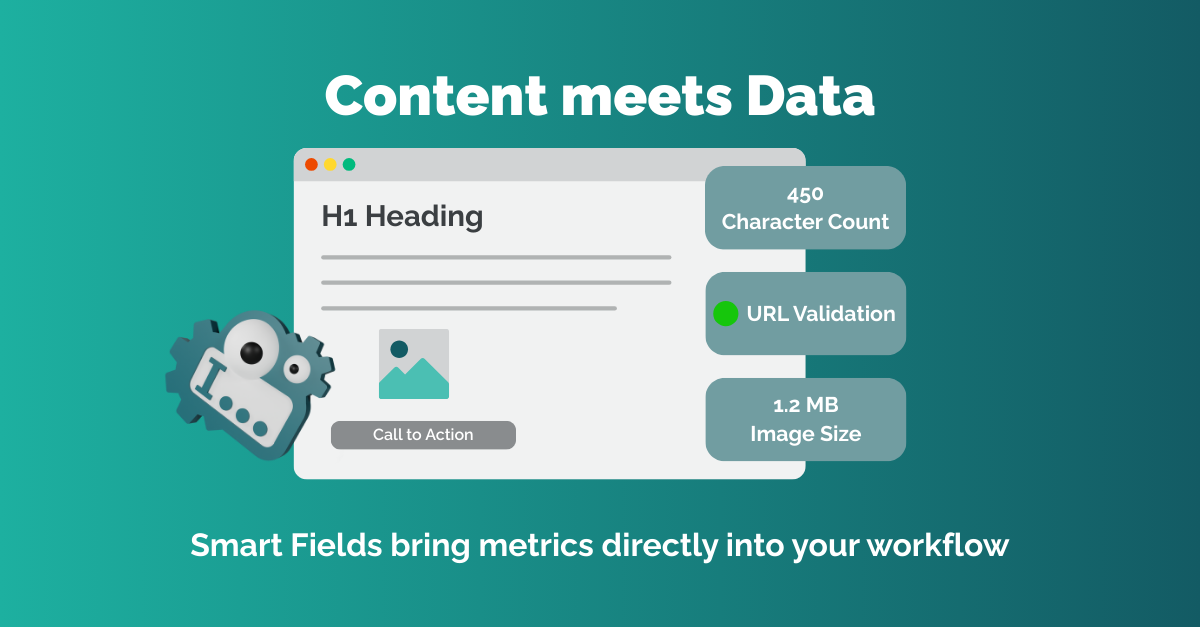
sumUp for monday is designed to cater to project managers, team leads, and anyone seeking a holistic perspective into their data with essential insights that aren't part of the standard offering. The app introduces custom dashboard widgets that transform data into meaningful visualizations.
With the Group by widget for monday you can summarize your key metrics easily in a calculation row.
The Two dimensional widget empowers you to construct comprehensive metric summaries by grouping them based on two different categorical columns.
Calculation rows are displayed both at the bottom and on the side, forming a matrix of sums for each row and column in the table.
No more tedious manual calculations or the absence of critical data views. Add the desired widget to your dashboard and watch your data transform into actionable information. Whether you need task tallies by due date, revenue by date and status, or work hours grouped by status, sumUp's widgets put the power of clear, concise metrics at your fingertips.
monday.com is project management software with numerous integrations with other programs, making it easier for the team to manage projects. Its reports can be seamlessly integrated with business intelligence (BI) tools with the help of connectors. We’ll discuss further how they provide quite many potential benefits for businesses.
monday.com Power BI integration is possible with the user-friendly Power BI Connector for monday.com by Alpha Serve. This integrational solution allows users to export various data sets such as Boards, Items, Workspaces, Users, and Tags without any coding expertise required, offering unlimited data set capabilities. With comprehensive data access and many tables and field options within the Data Source, users can automate Monday report extraction and apply advanced filters for enhanced data accuracy and flexibility.
The connector's user-friendly interface ensures easy installation and navigation, guaranteeing high performance and availability for all users. With dynamically generated Entity Relationship Diagrams and filtering capabilities, users can efficiently select and export pertinent data, facilitating informed decision-making. Plus, rest assured that a dedicated technical support team is available to address any inquiries or issues, supported by a comprehensive instructions guide to assist users and administrators alike. To start leveraging the benefits of the Power BI Connector for monday.com, simply click here to get started.
Tableau Connector for monday.com permits you to elevate the monday.com reporting experience with seamless integration. This user-friendly tool offers effortless navigation, enabling monday.com users to import unlimited data into Tableau, including Boards, Items, Workspaces, Users, and Tags. Customize your data with extensive table and field options, complemented by a dynamic Entity Relationship Diagram illustrating data relationships. Click here to begin leveraging the Tableau Connector for monday.com.
Tableau Connector for monday.com allows users to create data sources with unlimited tables and fields to generate custom visualizations tailored to specific business requirements. Navigate data relationships effortlessly with the intuitive Entity Relationship Diagram while filtering options streamline data selection for focused insights. The intuitive interface ensures a smooth start, complemented by comprehensive documentation, including instruction guides.
monday.com is more than a task and project manager; it is a tool where one can intervene in the organization and automation of many other aspects of the business. It helps to plan, modernize internal workflow, and provide high-level project outputs. But let’s look at some Monday.com tips and tricks.
In conclusion, monday.com is an easy-to-use and intuitive platform that makes it easy to keep team coordination in order in real time, automates manual work, and improves communication within the team in a digital workspace. The reporting on monday.com provides a new way of working and revolutionizes how teams handle reports, tracking the time spent on each project and building effective reports as a part of a business workflow. Turn marketing data into action, work smarter, and make monday.com reporting work for you.
Besseres Projektmanagement mit sumUp for monday durch sofort verfügbare Summen in Dashboard-Widgets.
Wir sind immer auf der Suche nach talentierten Menschen, die Lust auf digitale Herausforderungen haben.
Deine Stelle ist nicht dabei? Meld dich trotzdem, wenn du denkst, dass du den Unterschied machen kannst!


.jpg)
.png)


.png)


.png)


.jpeg)
![Last Log for Jira – Troubleshooting easier than ever [incl. Video]](https://cdn.prod.website-files.com/6400aa62efc52f275fa918d4/65aa7d8167dd440c0529c08e_Last%20Log%20for%20Jira_The%20key%20to%20troubleshooting%20in%20Jira.gif)


.jpg)


.png)


